Combined Structure Information Visualization - Presentaton Creation Menu
Here are visuals of all combined stucture concept visualizations.
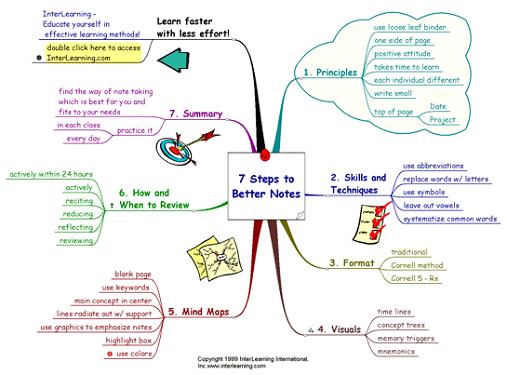
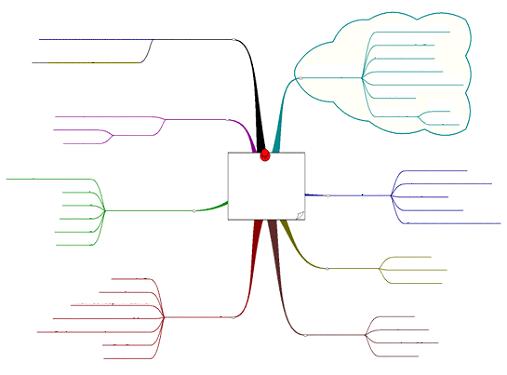
Mind Map - Divergent Thinking
A diagram used to represent words, ideas, tasks and other items linked to and arranged radially around a central key word or idea. This visual is freeflowing and has little limitations. Any idea that enters the mind can be inserted into the mind map.
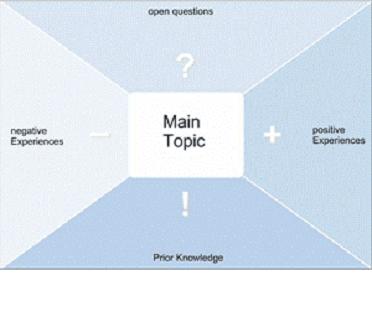
 Perspectives Diagram - Divergent Thinking
Shows how affecting perspectives affect the main process from all sides. The four different forces are but not limited to: open questions, positive experiences, prior knowledge, and negative experiences.
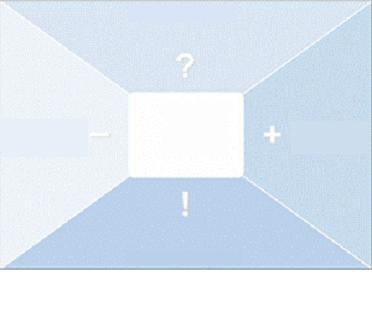
Perspectives Diagram - Divergent Thinking
Shows how affecting perspectives affect the main process from all sides. The four different forces are but not limited to: open questions, positive experiences, prior knowledge, and negative experiences.
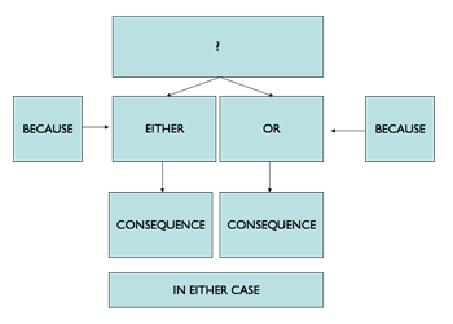
 Dilemma Diagram - Convergent Thinking
The dilemma diagram is a visual used to help solve a problem that has multiple solutions. It maps out possible outcomes to choose the best solution through evaluating events, reasons, consequences and final outcomes.
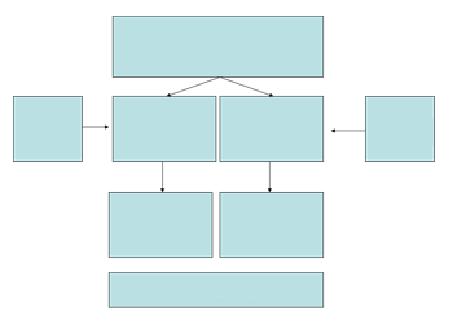
Dilemma Diagram - Convergent Thinking
The dilemma diagram is a visual used to help solve a problem that has multiple solutions. It maps out possible outcomes to choose the best solution through evaluating events, reasons, consequences and final outcomes.
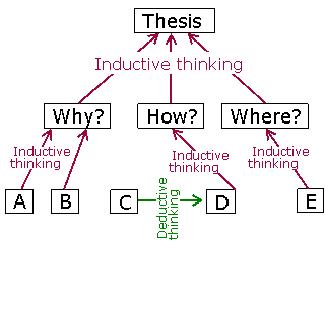
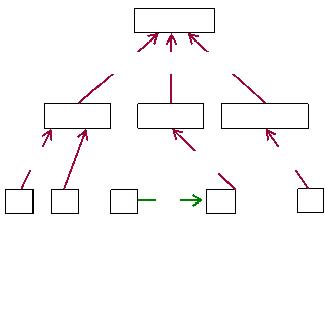
 Minto Pyramid Technique - Divergent Thinking
This visual is a hierarchically structured thinking and communication technique used to preceded good structured process / writing. It can also assist in speech making or explaining a process thoroughly.
Minto Pyramid Technique - Divergent Thinking
This visual is a hierarchically structured thinking and communication technique used to preceded good structured process / writing. It can also assist in speech making or explaining a process thoroughly.
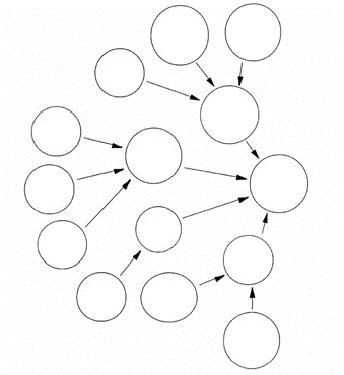
 Evocative Knowledge Maps - Divergent Thinking
A sort of idea mapping but general ideas are grouped together to end as final idea. This visual is useful if there are many suggestions for a process and this visual will show how the final solution was created.
Evocative Knowledge Maps - Divergent Thinking
A sort of idea mapping but general ideas are grouped together to end as final idea. This visual is useful if there are many suggestions for a process and this visual will show how the final solution was created.

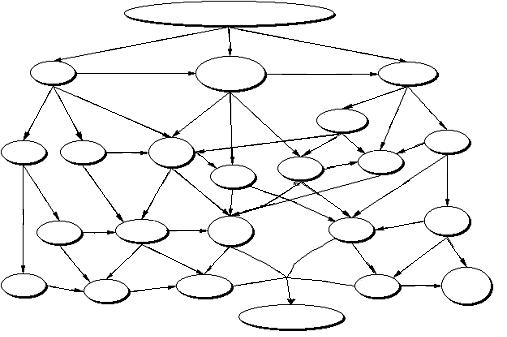
 Concept Map - Convergent Thinking
Similar to the evocative knowledge map, the concept map is a diagram showing relationship among concepts connected with labelled arrows, in a downward-branching hierarchical strcture.
Concept Map - Convergent Thinking
Similar to the evocative knowledge map, the concept map is a diagram showing relationship among concepts connected with labelled arrows, in a downward-branching hierarchical strcture.

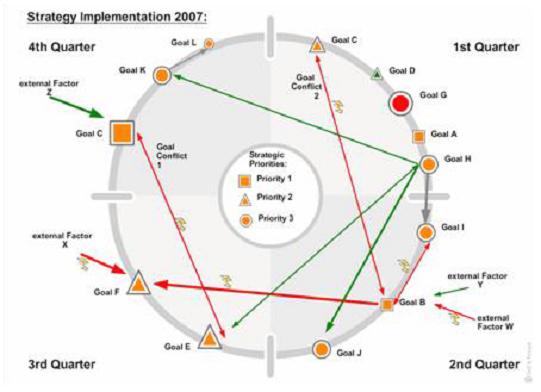
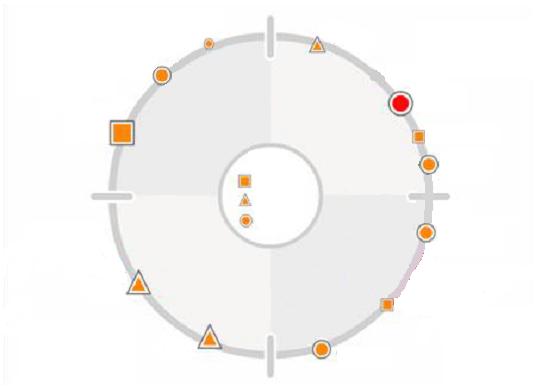
 Synergy Map - Divergent Thinking
Maps out processes on a circular graph and shows relationships among processes by linking them to eachother. It also processes visual flow effects and successions which the strategy will allow thus mapping out a potential process plan.
Synergy Map - Divergent Thinking
Maps out processes on a circular graph and shows relationships among processes by linking them to eachother. It also processes visual flow effects and successions which the strategy will allow thus mapping out a potential process plan.
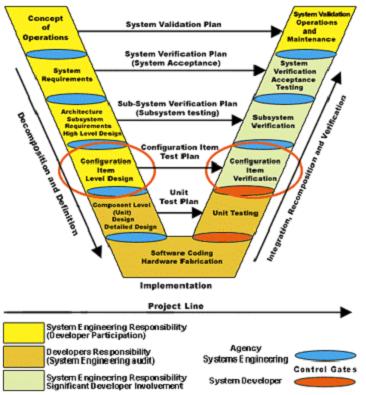
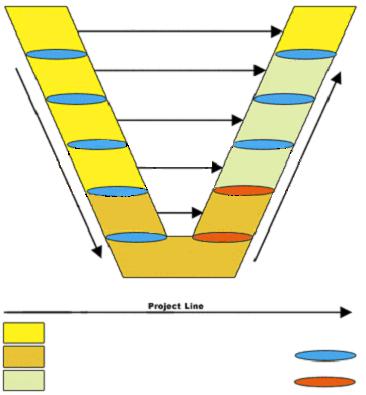
 Vee Diagram - Convergent Thinking
Provides a structure ensuring a strong theoretical and conceptual basis and solid analysis. Vee diagrams are a useful process breakdown tool that has a central focus question at the top with theoretical and conceptual information along the left side, a concrete study at the point of the V, and analysis and evaluation along the right side.
Vee Diagram - Convergent Thinking
Provides a structure ensuring a strong theoretical and conceptual basis and solid analysis. Vee diagrams are a useful process breakdown tool that has a central focus question at the top with theoretical and conceptual information along the left side, a concrete study at the point of the V, and analysis and evaluation along the right side.